Essay
Soft Drink Sales Narrative
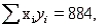
A soft drink distributor was interested in examining the relationship between the number of ads (x) for his product during prime time on a local television station and the number of sales per week (y) in 1000s of cases. She compiled the figures for 20 weeks and computed the following summary information: n = 20, 

 and
and  .
.
-Refer to Soft Drink Sales Narrative. Find the best-fitting line relating the number of ads during prime time and weekly sales.
Correct Answer:

Verified
Since  and...
View Answer
Unlock this answer now
Get Access to more Verified Answers free of charge
Correct Answer:
Verified
View Answer
Unlock this answer now
Get Access to more Verified Answers free of charge
Q1: A scatterplot is particularly useful in determining
Q2: Weekly Amount Spent on Groceries Narrative<br>The number
Q3: Selling Price and Age of Home Narrative<br>A
Q4: Generally speaking, if two variables are unrelated,
Q6: Meet Your Match Media Narrative<br>The Executive Board
Q7: Given that <img src="https://d2lvgg3v3hfg70.cloudfront.net/TB4962/.jpg" alt="Given that
Q8: Legislation Poll<br>A councillor was interested in determining
Q9: Gender Differences Narrative<br>Male and female respondents to
Q10: Gender Differences Narrative<br>Male and female respondents to
Q71: A perfect correlation between two variables will