Essay
Figure 19.3: U.S. Net Capital Outflows: 1970-2015 (Index, 2007 =100) 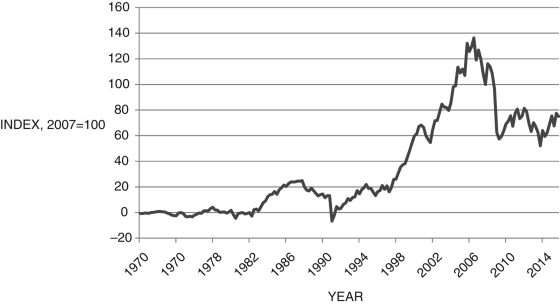
-Figure 19.3 shows U.S. net capital outflows from 1970-2015. Given this data, discuss the trade balance over this period. What relationship between net capital outflows and net exports did you use?
Correct Answer:

Verified
It is easier to answer the second questi...View Answer
Unlock this answer now
Get Access to more Verified Answers free of charge
Correct Answer:
Verified
View Answer
Unlock this answer now
Get Access to more Verified Answers free of charge
Q94: Which of the following CANNOT be used
Q95: Refer to the following table when answering
Q96: Figure 19.2: Foreign Assets in the U.S.
Q97: With intertemporal trade, trade imbalances move in
Q98: In China, total saving _ investment; therefore,
Q100: Which of the following had a trade
Q101: Which country had a trade balance in
Q102: Free labor migration is more effective at
Q103: From the national income identity, if:<br>A) <img
Q104: From the national income identity, if:<br>A)