Essay
Figure 18.4 below shows bond yields on U.S., Japanese, and German 10-year bonds, 1997-2014. The gray shaded areas represent Japanese recession dates. During this period the U.S. had two official recessions: one in 2001 and one from 2008-2009. Given this information and what you know about Japanese and American debt-to-GDP ratios, explain the reason(s) for the differences in Japanese and American bond yields.Figure 18.4: Japan and USA 10-Year Bond Yields and Japanese Recession Dates: 1997-2014 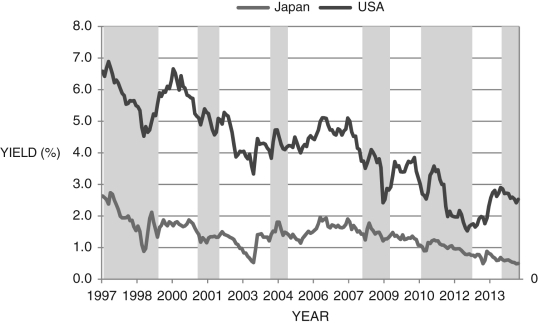
Correct Answer:

Verified
Chapters 12 and 14 offer insight into th...View Answer
Unlock this answer now
Get Access to more Verified Answers free of charge
Correct Answer:
Verified
View Answer
Unlock this answer now
Get Access to more Verified Answers free of charge
Q78: If a government has a difficult time
Q79: The largest debt-to-GDP ratio is in the
Q80: Which of the following countries has negative
Q81: If the government increases its budget deficit,
Q82: Refer to the following figure when answering
Q84: Which of the following is/are possible explanation(s)
Q85: Consider the government's intertemporal budget constraint: <img
Q86: An implication of the intertemporal budget constraint
Q87: The largest U.S. debt-to-GDP ratio occurred during
Q88: Of the following countries, the one with