Multiple Choice
Refer to the following figure when answering the following questions.
Figure 16.4: Personal Saving Rate: 1990-2010 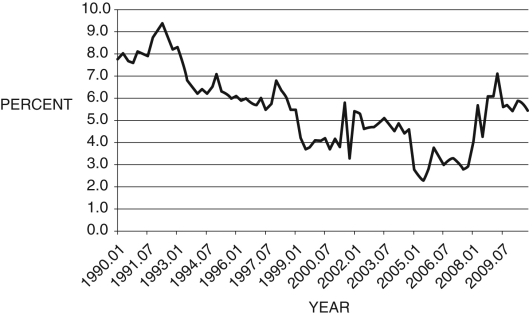
-Consider Figure 16.4. A possible cause for the change in the saving rate after about 2007 is:
A) precautionary saving.
B) consumption smoothing.
C) a falling discount factor.
D) rising marginal utility of consumption.
E) the aging of the baby boomers.
Correct Answer:

Verified
Correct Answer:
Verified
Q99: The utility function is constructed in such
Q100: Individuals who have restricted access to credit
Q101: If <img src="https://d2lvgg3v3hfg70.cloudfront.net/TB6622/.jpg" alt="If in
Q102: Which of the following summarize(s) the findings
Q103: Figure 16.6: Personal Savings Rate <img src="https://d2lvgg3v3hfg70.cloudfront.net/TB6622/.jpg"
Q104: In Figure 16.2, point c is equal
Q105: Figure 16.3: Daily Returns to Jim-Bob's Spark
Q107: Because people cannot perfectly foresee income changes
Q108: Consider Figure 16.10 below, which shows household
Q109: The utility function is constructed in such