Multiple Choice
Refer to the following figure when answering the following questions.
Figure 16.5: U.S. Household Net Worth 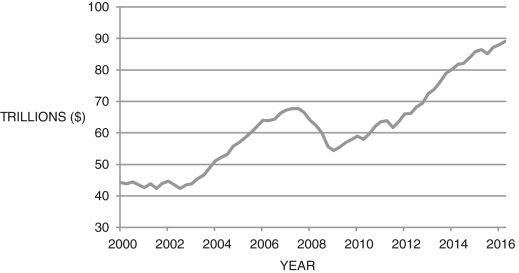
-Based on Figure 16.5, consumption ________ between roughly 2004 and 2007, which was likely due
To ________.
A) rose; a rise in precautionary savings
B) fell; worries about inflation
C) fell; a decline in interest rates
D) rose; the rise in wealth
E) was unchanged; consumption smoothing
Correct Answer:

Verified
Correct Answer:
Verified
Q72: With logarithmic utility, the Euler equation is
Q73: The left-hand side of the Euler equation,
Q74: The <img src="https://d2lvgg3v3hfg70.cloudfront.net/TB6622/.jpg" alt="The in
Q75: From the Euler equation, if <img src="https://d2lvgg3v3hfg70.cloudfront.net/TB6622/.jpg"
Q76: Are all households homogeneous and rational, at
Q78: If we lower taxes today but raise
Q79: If an individual has no access to
Q80: If you see low interest rates, you(r)
Q81: If we lower taxes today but raise
Q82: The intertemporal budget constraint basically states that:<br>A)