Multiple Choice
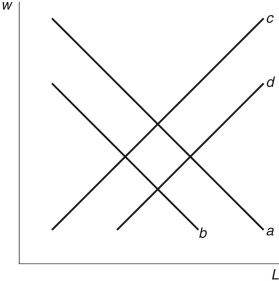
Refer to the following figure when answering the following questions.
Figure 15.1: The Labor Market 
-Consider Figure 15.1, which is a representation of the labor market. In 2005, Hurricane Katrina hit the Gulf Coast of the United States; this would cause a shift from curve ________ because this is an example of a(n) ________.
A)  increase in tax rates
B)  increase in government spending
C)  negative TFP shock
D)  rise in exchange rates
E) None of these answers is correct.
Correct Answer:

Verified
Correct Answer:
Verified
Q81: In the stylized DSGE model's representation of
Q82: Figure 15.1: The Labor Market <img src="https://d2lvgg3v3hfg70.cloudfront.net/TB6622/.jpg"
Q83: Figure 15.1: The Labor Market <img src="https://d2lvgg3v3hfg70.cloudfront.net/TB6622/.jpg"
Q84: Using the labor market in the stylized
Q85: A new colleague of yours decided to
Q87: In the impulse response function presented in
Q88: In the stylized DSGE model with sticky
Q89: Which of the following are frequent sources
Q90: In the labor supply model <img src="https://d2lvgg3v3hfg70.cloudfront.net/TB6622/.jpg"
Q91: Which of the following represents labor supply?<br>A)