Multiple Choice
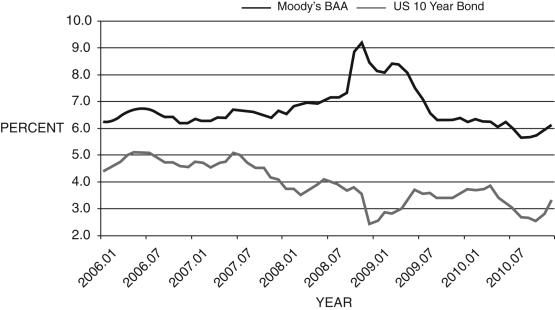
Figure 14.1: BAA and 10-Year Bonds, 2006-2010 
-Consider Figure 14.1. The difference between these two curves can be interpreted as:
A) the financial friction.
B) inflation expectations.
C) the risk-free rate.
D) a market imperfection.
E) the prime lending rate.
Correct Answer:

Verified
Correct Answer:
Verified
Q31: The average P/E ratio over the past
Q32: When the economy is in the liquidity
Q33: The financial friction raises the borrowing rate
Q34: When an economy is in a deflationary
Q35: The Monetary History of the United States,
Q37: The following statement is from the October
Q38: The Troubled Asset Relief Program was originally
Q39: Adding a financial friction to the short-run
Q40: In the aftermath of the recent financial
Q41: The liquidity trap occurs when:<br>A) real interest