menu-iconExamlexExamLexServices

Discover

Ask a Question
  1. All Topics
  2. Topic
    Business
  3. Study Set
    Macroeconomics Study Set 38
  4. Exam
    Exam 14: The Great Recession and the Short-Run Model
  5. Question
    Figure 141: BAA and 10-Year Bonds, 2006-2010
Solved

Figure 141: BAA and 10-Year Bonds, 2006-2010

Question 27

Question 27

Multiple Choice

Figure 14.1: BAA and 10-Year Bonds, 2006-2010 Figure 14.1: BAA and 10-Year Bonds, 2006-2010    -In Figure 14.1 above, the financial friction in late 2008 was about ________ percent. A)  9.5 B)  11 C)  6 D)  -7 E)  Not enough information is given.
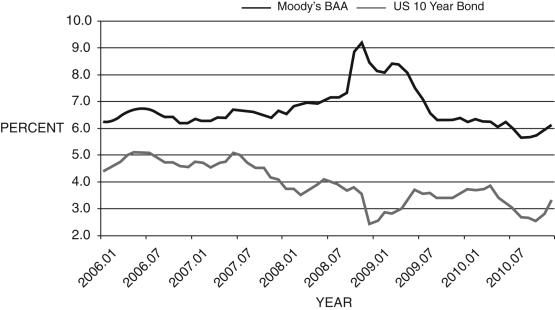
-In Figure 14.1 above, the financial friction in late 2008 was about ________ percent.


A) 9.5
B) 11
C) 6
D) -7
E) Not enough information is given.

Correct Answer:

verifed

Verified

Unlock this answer now
Get Access to more Verified Answers free of charge

Related Questions

Q22: In financial markets, a "living will" is:<br>A)

Q23: When the Fed lowers the nominal interest

Q24: The federal budget deficit _ in 2009

Q25: Bailouts of the financial sector:<br>A) worsen the

Q26: The price-to-earnings ratio is useful in identifying

Q28: Economists believe that bailing out banks in

Q29: Refer to the following figure when answering

Q30: When a financial friction is added to

Q31: The average P/E ratio over the past

Q32: When the economy is in the liquidity

Examlex

ExamLex

About UsContact UsPerks CenterHomeschoolingTest Prep

Work With Us

Campus RepresentativeInfluencers

Links

FaqPricingChrome Extension

Download The App

Get App StoreGet Google Play

Policies

Privacy PolicyTerms of ServiceHonor CodeCommunity Guidelines

Scan To Download

qr-code

Copyright © (2025) ExamLex LLC.

Privacy PolicyTerms Of ServiceHonor CodeCommunity Guidelines