Essay
Figure 14.6: 90-Day Interbank Interest Rates for the Euro Area and the U.S. 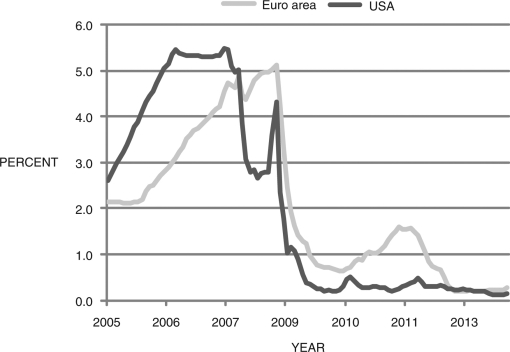 (Source: FRED II)
-Figure 14.6 shows the 90-day interbank interest rates for the euro area and the United States, 2005-2014, which are proxies for short-term sovereign debt. What does this graph say about risk in the euro area and the United States?
Correct Answer:

Verified
The measure of risk can be calculated us...View Answer
Unlock this answer now
Get Access to more Verified Answers free of charge
Correct Answer:
Verified
View Answer
Unlock this answer now
Get Access to more Verified Answers free of charge
Q10: In dollars, the magnitude of the Fed's
Q11: By 2016 (and in the aftermath of
Q12: Refer to the following figure when answering
Q13: The difference between the three-month bond yield
Q14: Briefly discuss the Fed's balance sheet before
Q16: Refer to the following figure when answering
Q17: In a paper by Minneapolis Fed bank
Q18: The March 20, 2013, Federal Open Market
Q19: According to the secular stagnation explanation, the
Q20: Your uncle is pleased to hear you