Essay
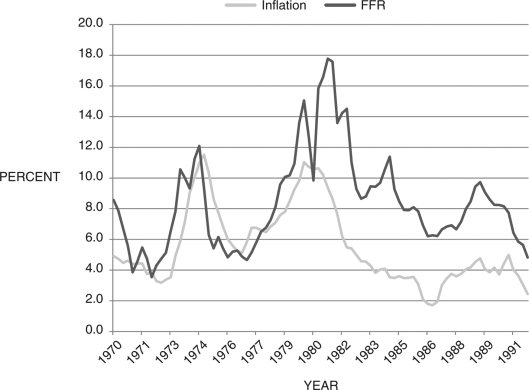
The figure below shows inflation and the federal funds rate for the years 1970-1991. What policy rule does the Fed appear to be following during this period? Suppose the Fed adopts a different policy rule, to manage inflation expectations. Derive your own monetary policy rule that takes inflation expectations into consideration.Figure 13.6: Inflation and the Federal Funds Rate: 1970-1991 
Correct Answer:

Verified
The Fed appears to be following the simp...View Answer
Unlock this answer now
Get Access to more Verified Answers free of charge
Correct Answer:
Verified
View Answer
Unlock this answer now
Get Access to more Verified Answers free of charge
Q65: The simple monetary rule states that if
Q66: If the current rate of inflation is
Q67: The fact that any model that utilizes
Q68: The advantage of an explicit inflation target
Q69: Refer to the following figure when answering
Q71: Economic forecasters use the term structure of
Q72: Canada has an explicit inflation target.
Q73: The simple monetary policy rule discussed at
Q74: If policymakers suffer from time inconsistency, they
Q75: In the presence of rational expectations, the