Multiple Choice
Figure 12.7: Output 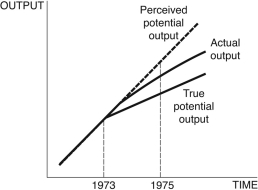
-Consider Figure 12.7. You are chairman of the Federal Reserve in 1975. You believe potential output follows the dotted line after 1973, but in actuality, it follows the line denoted "True potential output." The current state of the economy is given by the curve "Actual output." Given the information in the figure, you ________, because you believe the economy is in a ________, but your advice instead ________.
A) lower interest rates; recession; accelerates inflation
B) raise interest rates; recession; accelerates inflation
C) keep interest rates the same; boom; accelerates inflation
D) lower interest rates; boom; increases unemployment
E) Not enough information is given.
Correct Answer:

Verified
Correct Answer:
Verified
Q10: Refer to the following figure when answering
Q11: The money demand curve:<br>A) slopes downward with
Q12: When economists say "sticky inflation," they mean
Q13: When the Fed targets the interest rate,
Q14: Once a _ is chosen, the main
Q16: Refer to the following figure when answering
Q17: In a weakening economy, you might expect
Q18: The interest rate that the Fed charges
Q19: One of the explanations for the high
Q20: If the central bank is targeting the