Multiple Choice
Refer to the following figure when answering the following questions.
Figure 12.10: Output Gap: 1990-2000 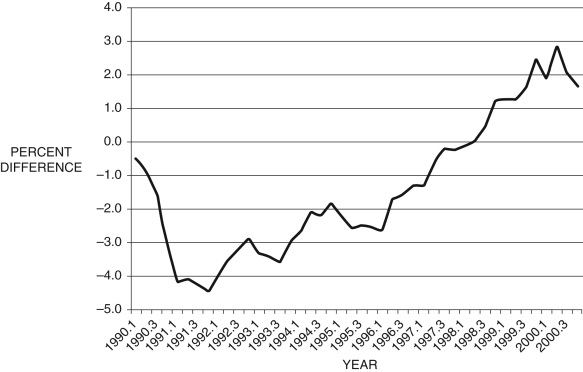
-Consider Figure 12.10, which shows the output gap  from 1990 to 2000, by quarter. If this is all the information you have, during the period 1993.1-1993.4, from the Phillips curve, you would conclude that:
A) inflation is decelerating, 0.
B) inflation is accelerating, 0.
C) unemployment is falling.
D) unemployment is rising.
E) Not enough information is given.
Correct Answer:

Verified
Correct Answer:
Verified
Q71: Refer to the following figure when answering
Q72: You have been asked to spend a
Q73: Which of the following scenarios best describes
Q74: When the Federal Reserve increases the interest
Q75: The most immediate and visible form of
Q77: "Adaptive expectations" implies that firms adjust their
Q78: The link between real and nominal interest
Q79: The federal funds rate is:<br>A) equal to
Q80: Refer to the following figure when answering
Q81: According to the Fisher equation, the real