Multiple Choice
Refer to the following figure when answering the following questions.
Figure 12.10: Output Gap: 1990-2000 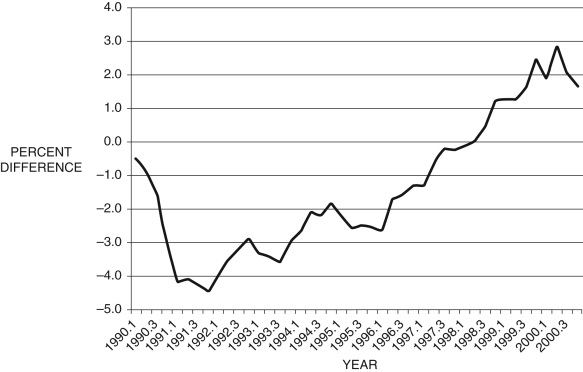
-Consider Figure 12.10, which shows the output gap  from 1990 to 2000, by quarter. If this is all the information you have, during the period 1997.1-1999.4, from the Phillips curve, you would conclude that:
A) inflation is accelerating, 0.
B) inflation is decelerating, 0.
C) unemployment is falling.
D) unemployment is rising.
E) Not enough information is given.
Correct Answer:

Verified
Correct Answer:
Verified
Q31: Based on the reasoning of the original
Q32: Figure 12.16: Output <img src="https://d2lvgg3v3hfg70.cloudfront.net/TB6622/.jpg" alt="Figure 12.16:
Q33: According to the quantity theory of money,
Q34: The economywide rate of inflation is given
Q35: A key assumption of the short-run model
Q37: Firms alter their prices based on:<br>A) expected
Q38: Figure 12.19: Change in Inflation (
Q39: One of the remarkable things about the
Q40: In the Phillips curve, <img src="https://d2lvgg3v3hfg70.cloudfront.net/TB6622/.jpg" alt="In
Q41: When a central bank targets the money