Essay
Consider Figure 12.14 below, which shows the price of oil from January 2005-December 2010. What are the impacts of this on the macroeconomy? In particular, which macroeconomic relationship does this impact? Explain.Figure 12.14: Percent Change Oil Price 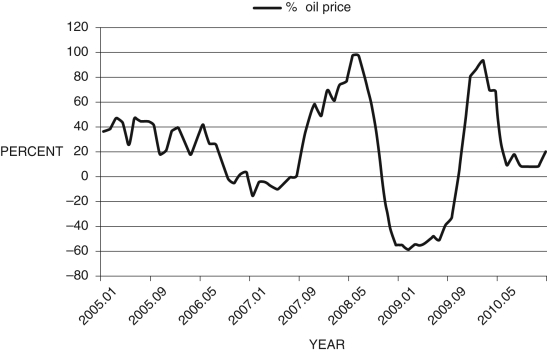
Correct Answer:

Verified
Oil prices are a form of cost shock,  , ...
, ...View Answer
Unlock this answer now
Get Access to more Verified Answers free of charge
Correct Answer:
Verified
View Answer
Unlock this answer now
Get Access to more Verified Answers free of charge
Q125: As lender in the last resort, the
Q126: Which of the following contributed to high
Q127: When the Federal Reserve increases the interest
Q128: Oil prices are closely watched because:<br>A) they
Q129: According to the Phillips curve, if the:<br>A)
Q131: Refer to the following figure when answering
Q132: Economists who study monetary policy believe that
Q133: In the Phillips curve, <img src="https://d2lvgg3v3hfg70.cloudfront.net/TB6622/.jpg" alt="In
Q134: The real interest rate is given by
Q135: According to the Phillips curve, if current