Multiple Choice
Refer to the following figure when answering the following questions.
Figure 11.1: Growth rates of real investment and consumption 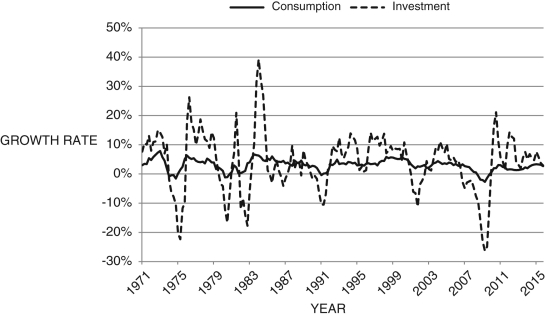 (Source: U.S. Bureau of Economic Analysis)
-Consider Figure 11.1. What explains the difference in the volatility of each series?
A) Firms are predictable.
B) differences in expectations across firms
C) differences in expenditure shares
D) Firms do not make investment decisions based on interest rates.
E) Households consumption-smooth.
Correct Answer:

Verified
Correct Answer:
Verified
Q101: In the equation <img src="https://d2lvgg3v3hfg70.cloudfront.net/TB6622/.jpg" alt="In the
Q102: According to the IS curve, when interest
Q103: When the multiplier is included in the
Q104: In the long run, the marginal product
Q105: The basic IS model embodies the life-cycle
Q107: Which of the following describes the consumption
Q108: In the long run, if the marginal
Q109: What is the relationship between the real
Q110: Every six to eight weeks, or so,
Q111: The life-cycle hypothesis suggests that people base