Essay
Consider Figure 11.8 below, which shows the output gap and the NASDAQ stock market index from 1995-2001. NASDAQ has a lot of "tech" firms that drove the rise in the stock market index in the late 1990s, as shown. As one can see, the output gap also rose to about 2.8 percent in April 2000. Explain this graph using the IS curve.Figure 11.8: Output Gap and NASDQ Index 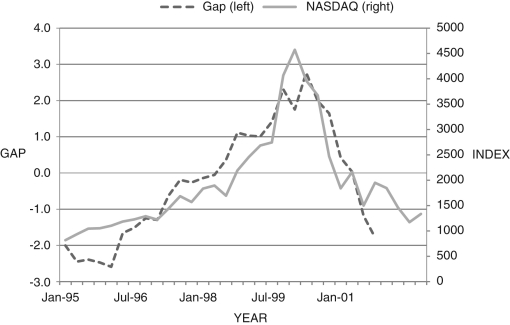
Correct Answer:

Verified
This question can be answered two ways:
...View Answer
Unlock this answer now
Get Access to more Verified Answers free of charge
Correct Answer:
Verified
...
View Answer
Unlock this answer now
Get Access to more Verified Answers free of charge
Q34: When there is a change to potential
Q35: A key assumption of Ricardian equivalence is:<br>A)
Q36: In the long run, the:<br>A) federal funds
Q37: In the long run, <img src="https://d2lvgg3v3hfg70.cloudfront.net/TB6622/.jpg" alt="In
Q38: During a recession, increases in unemployment insurance,
Q40: The foundation of the IS curve is
Q41: Refer to the following figure when answering
Q42: U.S. government spending on goods and services:<br>A)
Q43: Suppose we assume that initially <img src="https://d2lvgg3v3hfg70.cloudfront.net/TB6622/.jpg"
Q44: One hypothesis for the lack of success