Multiple Choice
The following table shows real GDP and potential real GDP for the years 2005-2015. Refer to this table when answering the following questions.
Table 10.1 ($ billions) 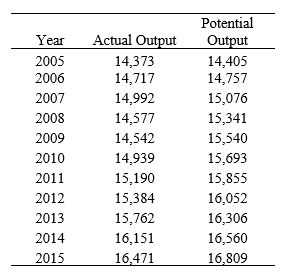 (Source: Federal Reserve Economic Data, St. Louis Federal Reserve)
-About how much did short-run output equal in 2009 and 2015, respectively?
A) -6.4 percent; -2.0 percent
B) 6.9 percent; 2.1 percent
C) 93.6 percent; 98.0 percent
D) 106.9 percent; 102.1 percent
E) Not enough information is given.
Correct Answer:

Verified
Correct Answer:
Verified
Q54: Between May 2004 and May 2006, the
Q55: Which of the following is/are NOT (an)
Q56: The federal funds rate is the rate
Q57: If the value of this bank's investments
Q58: Figure 10.4: U.S. Inflation, 2000-2015 <img src="https://d2lvgg3v3hfg70.cloudfront.net/TB6622/.jpg"
Q60: Refer to the following table when answering
Q61: Refer to the following table when answering
Q62: Between the middle of 2006 and the
Q63: The basic principle of securitization is that
Q64: Which of the following financial institutions was