Multiple Choice
Refer to the following figure when answering the following questions.
Figure 9.2: U.S. Output Fluctuations 1960-2015 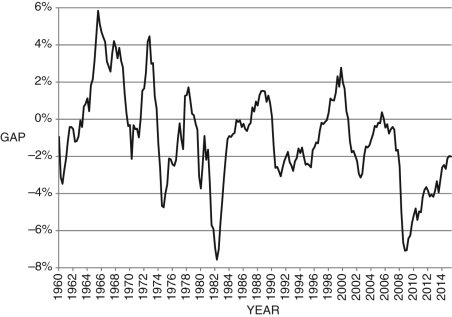
-Consider Figure 9.2. The line represents short-run fluctuations,  . Since 1960, the largest economic "boom" was in about ________ and the deepest recession was in about ________.
A) 1983; 1965
B) 1974; 1976
C) 2000; 1983
D) 1966; 1983
E) The economy always produces at its potential.
Correct Answer:

Verified
Correct Answer:
Verified
Q45: The Phillips curve shows the negative relationship
Q46: Which of the following is NOT an
Q47: Defining <img src="https://d2lvgg3v3hfg70.cloudfront.net/TB6622/.jpg" alt="Defining as
Q48: Suppose an economy exhibits a large unexpected
Q49: Refer to the following figure when answering
Q51: According to the text, which of the
Q52: If current output is <img src="https://d2lvgg3v3hfg70.cloudfront.net/TB6622/.jpg" alt="If
Q53: Yale professor Ray Fair uses _ to
Q54: Refer to the following figure when answering
Q55: Which of the following is NOT an