Multiple Choice
Refer to the following figure when answering the following questions.
Figure 9.5: U.S. Inflation 1960-2015 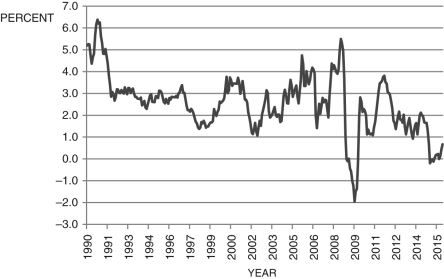 (Source: Bureau of Labor Statistics)
-Consider Figure 9.5, which shows the annual inflation rate. According to the Phillips curve, the period from about 2003 to 2005 was a period of:
A) a slumping economy.
B) a booming economy.
C) stagnation.
D) None of these answers is correct.
E) Not enough information is given.
Correct Answer:

Verified
Correct Answer:
Verified
Q36: Taken together, the Phillips curve and Okun's
Q37: Consider two economies. Economy 1 has a
Q38: According to the text, which of the
Q39: What is the best definition of the
Q40: You are a staff economist with the
Q42: Defining u as the unemployment rate and
Q43: According to the text, the slope of
Q44: The Phillips curve in the text shows
Q45: The Phillips curve shows the negative relationship
Q46: Which of the following is NOT an