True/False
Figure 9.6: Economic Boom versus Recession 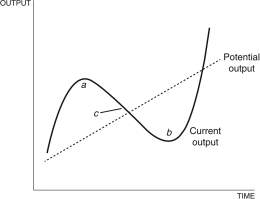
-In Figure 9.6 above, area b represents an economic boom, and area a is a recession.
Correct Answer:

Verified
Correct Answer:
Verified
Related Questions
Q51: According to the text, which of the
Q52: If current output is <img src="https://d2lvgg3v3hfg70.cloudfront.net/TB6622/.jpg" alt="If
Q53: Yale professor Ray Fair uses _ to
Q54: Refer to the following figure when answering
Q55: Which of the following is NOT an
Q57: Defining u as the unemployment rate and
Q58: Defining u as the unemployment rate and
Q59: Output fluctuations are defined as:<br>A) the amount
Q60: What does Okun's law state?
Q61: Figure 9.7: The Output Gap 1980-2015 <img