Essay
Consider the following three figures, which show the Phillips curve relationship for the 1970s, 1980s, and 1990s. The output gap is on the x-axis and the change in inflation, , is on the y-axis. Explain what each of these Phillips curves tells us about each of the three decades. In which period would fighting inflation be the most difficult?Figure 9.9: Phillips Curve Relationship, 1970s 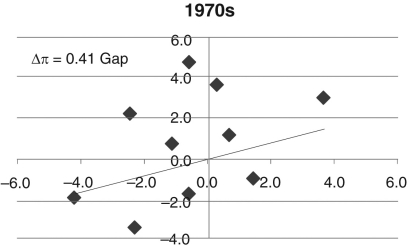
Figure 9.10: Phillips Curve Relationship, 1980s 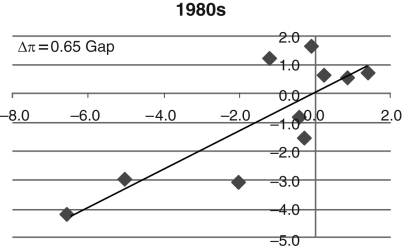
Figure 9.11: Phillips Curve Relationship, 1990s 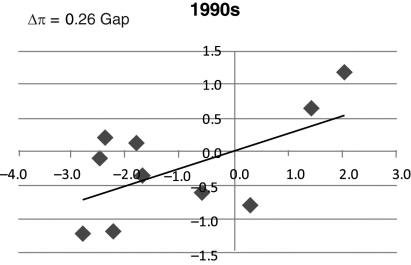
Correct Answer:

Verified
First, we note the Phillips curve relati...View Answer
Unlock this answer now
Get Access to more Verified Answers free of charge
Correct Answer:
Verified
View Answer
Unlock this answer now
Get Access to more Verified Answers free of charge
Q94: If <img src="https://d2lvgg3v3hfg70.cloudfront.net/TB6622/.jpg" alt="If ,
Q95: When the U.S. economy bottomed out during
Q96: An increase in planned investment expenditures is
Q97: If current output is <img src="https://d2lvgg3v3hfg70.cloudfront.net/TB6622/.jpg" alt="If
Q98: Current output is defined as:<br>A) the amount
Q100: Taxes, oil price changes, government spending, interest
Q101: How is a recession "officially" determined?
Q102: Generally speaking, the rate of inflation _
Q103: Refer to the following figure when answering
Q104: Refer to the following figure to answer