Multiple Choice
Figure 8.1: Money Growth and Inflation in the United States by Decade 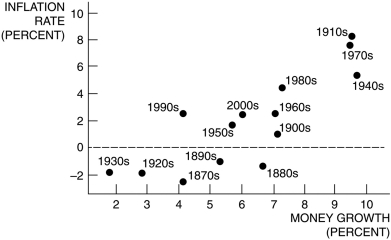
-The data presented in Figure 8.1 confirm that the relationship between inflation and money growth is ________, as suggested by ________.
A) positive; the Fisher equation
B) positive; money neutrality
C) positive; the quantity theory of money
D) negative; the quantity theory of money
E) None of these answers is correct.
Correct Answer:

Verified
Correct Answer:
Verified
Q12: The velocity of money is:<br>A) another way
Q13: When inflation is high and people are
Q14: According to the quantity theory of money,
Q15: Using the quantity equation, if M<sub>t</sub> =
Q16: If some goods' prices adjust more quickly
Q18: The velocity of money is defined as
Q19: If income tax rates are based on
Q20: According to the quantity equation, the cure
Q21: The implications of the quantity theory of
Q22: If the inflation rate is higher than