Essay
Table 8.1 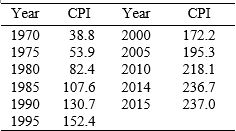
(Source: U.S. Bureau of Labor Statistics)
Considering the end-of-year CPI data in Table 8.1:
(a) Calculate the rate of inflation between 1970 and 1975 and between 1995 and 2000.
(b) Calculate the average rate of inflation for 1970-1975 and 1970-1980.
(c) Calculate the average rate of inflation for 2000-2010 and 2014-2015.
(d) Briefly comment on your results.
Correct Answer:

Verified
(a) Use the equation  .
.
For 1970-1975:
1...View Answer
Unlock this answer now
Get Access to more Verified Answers free of charge
Correct Answer:
Verified
For 1970-1975:
1...
View Answer
Unlock this answer now
Get Access to more Verified Answers free of charge
Q50: M2 includes M1 and:<br>A) large time deposits.<br>B)
Q51: Table 8.2: Monetary Aggregates (in billions) <img
Q52: In the United States, decisions about monetary
Q53: Suppose you put $100 in the bank
Q54: Short-term treasury bills are the most liquid
Q56: The price controls imposed by the Nixon
Q57: Money neutrality is the proposition that changes
Q58: Money made with silver, gold, and chocolate
Q59: Sometimes when discussing inflation, we use a
Q60: Inflation _ price volatility and _ allocative