Multiple Choice
Refer to the following table to answer the following questions.
Table 7.1: U.S. Employment Status (in thousands) 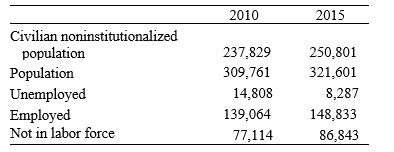
-Consider Table 7.1. Between 2010 and 2015, the employment-population ratio ________ to/at ________.
A) fell; 58.5 percent
B) rose; 90.4 percent
C) stayed more or less the same; 37.9 percent
D) fell; 5.3 percent
E) rose; 59.3 percent
Correct Answer:

Verified
Correct Answer:
Verified
Q106: Refer to the following figure to answer
Q107: Historically, young French workers (under age 25)
Q108: An increase in the income taxes on
Q109: One consequence of wage rigidity is:<br>A) lower
Q110: Of the richest countries, the Japanese spend
Q112: In 2010, the college wage premium was
Q113: Between 1960 and 2000, the:<br>A) employment-population ratio
Q114: Refer to the following figure when answering
Q115: The gradual rise in unemployment in the
Q116: The quote "It's a recession when your