Multiple Choice
Refer to the following figure to answer the following questions.
Figure 7.1: U.S. Unemployment Rate: 1975-2015 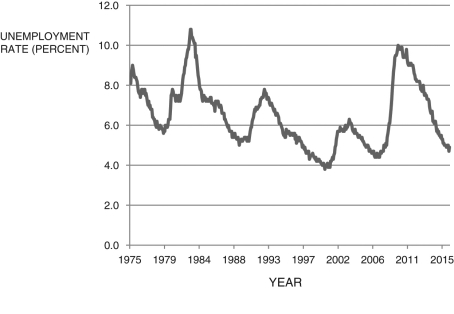 (Source: U.S. Bureau of Labor Statistics)
-Using Figure 7.1, Which of the following year(s) are the approximate trough of a recession?
A) 1975
B) 1983
C) 2011
D) All of these answers are correct.
E) None of these answers is correct.
Correct Answer:

Verified
Correct Answer:
Verified
Q30: Most of the total weeks of lost
Q31: Generally, during a recession:<br>A) inflation rises.<br>B) the
Q32: The labor market determines the:<br>A) equilibrium wage.<br>B)
Q33: In the 1960s, European unemployment rates were
Q34: The labor demand curve slopes downward because:<br>A)
Q36: The demand for labor curve is:<br>A) downward
Q37: Refer to the following table to answer
Q38: According to data presented in the text,
Q39: The present discounted value equation, <img src="https://d2lvgg3v3hfg70.cloudfront.net/TB6622/.jpg"
Q40: Refer to the following table to answer