Multiple Choice
Refer to the following figure to answer the following questions.
Figure 7.1: U.S. Unemployment Rate: 1975-2015 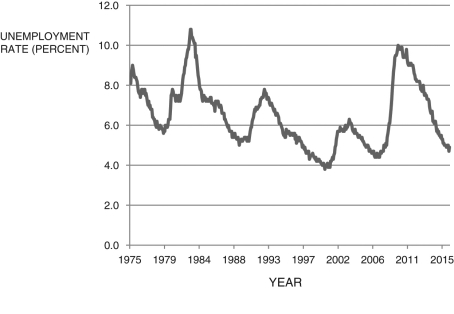 (Source: U.S. Bureau of Labor Statistics)
-Using Figure 7.1, Which of the following year(s) are the approximate trough of a recession?
A) 2001
B) 1983
C) 1979
D) 2012
E) All of these answers are correct.
Correct Answer:

Verified
Correct Answer:
Verified
Q1: Which of the following is NOT a
Q2: The idea that you value receiving $1,000
Q3: In the labor market depicted in Figure
Q4: The natural rate of unemployment is the
Q5: The unemployment rate is defined as the
Q7: If the civilian noninstitutionalized population is 230,108,
Q8: Refer to the following figure when answering
Q9: Refer to the following table to answer
Q10: The cause(s) of increased female participation in
Q11: If the minimum wage is set below