Multiple Choice
Refer to the following figure to answer the following questions.
Figure 7.1: U.S. Unemployment Rate: 1975-2015 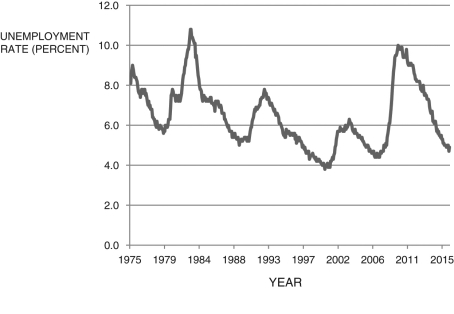 (Source: U.S. Bureau of Labor Statistics)
-Using Figure 7.1, The approximate year of the peak of the boom was:
A) 1982.
B) 1992.
C) 2005.
D) 2010.
E) 1990.
Correct Answer:

Verified
Correct Answer:
Verified
Q39: The present discounted value equation, <img src="https://d2lvgg3v3hfg70.cloudfront.net/TB6622/.jpg"
Q40: Refer to the following table to answer
Q41: You win the lottery, which pays $1
Q42: The natural rate of unemployment is equal
Q43: Wage rigidity decreases labor market volatility.
Q45: A decrease in the income tax will
Q46: The net change in employment is:<br>A) new
Q47: Refer to the following table 7.2 when
Q48: Refer to the following figure when answering
Q49: An increase in labor regulations results in:<br>A)