Multiple Choice
Refer to the following figure to answer the following questions.
Figure 7.1: U.S. Unemployment Rate: 1975-2015 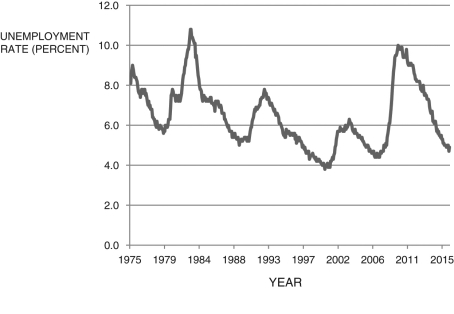 (Source: U.S. Bureau of Labor Statistics)
-Given the unemployment rate data depicted in Figure 7.1, the year of the peak of the boom was:
A) 1993.
B) 2001.
C) 1983.
D) 2010.
E) 1992.
Correct Answer:

Verified
Correct Answer:
Verified
Q78: A key reason that unemployment in the
Q79: Europe's relatively high unemployment rates can be
Q80: The natural rate of unemployment is equal
Q81: If the minimum wage is set above
Q82: Unemployment is given by _ unemployment and
Q84: The present discounted value equation <img src="https://d2lvgg3v3hfg70.cloudfront.net/TB6622/.jpg"
Q85: When a firm purchases more capital, ceteris
Q86: Refer to the following table 7.2 when
Q87: According to payscale.com, the average salary for
Q88: Unemployment generally falls during economic booms.