Multiple Choice
Refer to the following figure when answering the following questions.
Figure 7.2: United Kingdom Unemployment Rate: 1971-2015 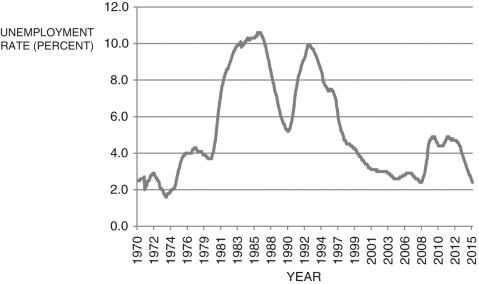 (Source: OECD and Federal Reserve Economic Data, Federal Reserve Bank of St. Louis)
-Given the U.K. unemployment rate data depicted in Figure 7.2, the approximate year of the peak of the boom was:
A) 1989.
B) 1986.
C) 1992.
D) 2009.
E) 1972.
Correct Answer:

Verified
Correct Answer:
Verified
Q69: Since the end of World War II,
Q70: Consider the simplified payment system to compensate
Q71: Figure 7.7: Unemployment Rate 1975-2015 <img src="https://d2lvgg3v3hfg70.cloudfront.net/TB6622/.jpg"
Q72: The rise in the employment-population ratio between
Q73: The unemployment rate in Europe has always
Q75: Refer to the following table to answer
Q76: The idea that you value receiving $1,000
Q77: A drawback of unemployment benefits is that:<br>A)
Q78: A key reason that unemployment in the
Q79: Europe's relatively high unemployment rates can be