Essay
Consider the data in Table 7.3 below. What is the natural rate of unemployment in each of these years? Explain your answer.Table 7.3: Labor Market Statistics 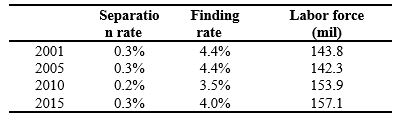
Correct Answer:

Verified
We simply need to use the equation  .
.
Pl...View Answer
Unlock this answer now
Get Access to more Verified Answers free of charge
Correct Answer:
Verified
We simply need to use the equation .
Pl...
Pl...
View Answer
Unlock this answer now
Get Access to more Verified Answers free of charge
Related Questions
Q59: Historically, for most Americans, the length of
Q60: Figure 7.6: Labor Force Participation Rate: 2000-2015
Q61: An increase in the income tax causes
Q62: In the labor market depicted in Figure
Q63: Refer to the following figure when answering
Q65: Of the richest countries, _ worked the
Q66: Refer to the following figure when answering
Q67: Because of the dynamics of the workforce,
Q68: The explanation for the upward-sloping supply of
Q69: Since the end of World War II,