Multiple Choice
Figure 6.1: Romer Model: Per Capita Output 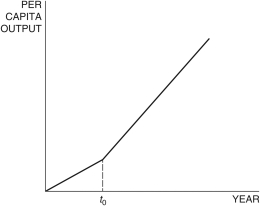
-In the Romer model in Figure 6.1, at time t0, a change in the growth rate of per capita output can be explained by a(n) :
A) decrease in the ideas efficiency parameter.
B) increase in the population.
C) increase in the share of labor engaged in research.
D) increase in the saving rate.
E) decrease in the population.
Correct Answer:

Verified
Correct Answer:
Verified
Q17: Consider the Romer model. If the percentage
Q18: In the Romer model, the growth rate
Q19: In the combined Solow-Romer model, the growth
Q20: For the years 2011-2015, if output per
Q21: In the combined Solow-Romer model, an exogenous
Q23: Consider the Cobb-Douglas production function <img src="https://d2lvgg3v3hfg70.cloudfront.net/TB6622/.jpg"
Q24: In economics, a rival good is one
Q25: Consider the data in the following
Q26: In the growth accounting equation, <img src="https://d2lvgg3v3hfg70.cloudfront.net/TB6622/.jpg"
Q27: If Y is a good's output, X