Multiple Choice
Figure 6.2: Romer Model: Per Capita Output 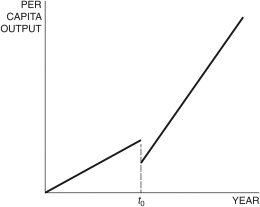
-In the Romer model in Figure 6.2, at time t0, a change in the shape of the production function can be explained by an increase in the:
A) population.
B) share of labor engaged in research.
C) ideas efficiency parameter.
D) saving rate.
E) growth rate.
Correct Answer:

Verified
Correct Answer:
Verified
Q69: For the years 1948-1973, output per person
Q70: Which of the following is a nonrival
Q71: In the combined Solow-Romer model, the total
Q72: "Growth accounting" endeavors to:<br>A) measure GDP.<br>B) measure
Q73: Nonrivalry in the Romer model means that
Q75: Because in many industries the cost of
Q76: In the Romer model, the more labor
Q77: The production function <img src="https://d2lvgg3v3hfg70.cloudfront.net/TB6622/.jpg" alt="The production
Q78: In growth accounting, if we subtract the
Q79: The production of new ideas in the