Essay
Consider the table below, which shows the number of researchers in R&D (per million) in 2010 and the average growth rate of real GDP for the years 1985-2014. Explain how the Romer model explains the relationship between the number of researchers and economic growth. Given your answer, does the data below corroborate your story? How might you explain any inconsistencies between the data and the model?Table 6.2 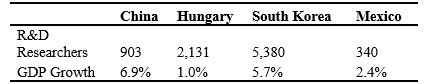
(Source: Penn World Tables 9.0 and the World Bank)
Correct Answer:

Verified
In the Romer model we have two basic equ...View Answer
Unlock this answer now
Get Access to more Verified Answers free of charge
Correct Answer:
Verified
View Answer
Unlock this answer now
Get Access to more Verified Answers free of charge
Q96: Figure 6.2: Romer Model: Per Capita Output
Q97: Consider the following data: <img src="https://d2lvgg3v3hfg70.cloudfront.net/TB6622/.jpg" alt="Consider
Q98: Labor composition is used in "growth accounting"
Q99: The reason perfect competition cannot generate new
Q100: Which of the following can be used
Q102: There is no difference between the stock
Q103: An allocation that is _ exists if
Q104: Suppose the Romer model parameters in East
Q105: The parameter(s) in the Romer model is/are
Q106: In the Romer model, the growth rate