Multiple Choice
Refer to the following figure when answering the following questions.
Figure 5.1: Solow Diagram 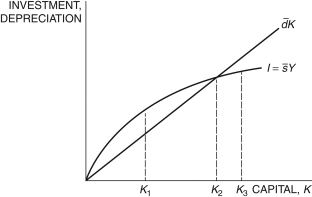
-In Figure 5.1, the capital stock at K1 is not the steady state because:
A) the saving rate is too low.
B) the saving rate is too high.
C) the depreciation rate is too low.
D) gross investment is higher than capital depreciation.
E) gross investment is lower than capital depreciation.
Correct Answer:

Verified
Correct Answer:
Verified
Q1: If South Korea's steady-state GDP per worker
Q2: You are asked to make comparisons of
Q3: Refer to the following figure when answering
Q4: The key insight in the Solow model
Q5: A decline in the saving rate causes
Q7: According to the Solow model, in the
Q8: In the Solow model, if capital is
Q9: Refer to the following figure when answering
Q10: If South Korea's steady-state GDP per worker
Q11: Assume two economies are identical in every