Multiple Choice
Refer to the following figure when answering the following questions.
Figure 5.3: Solow Diagram 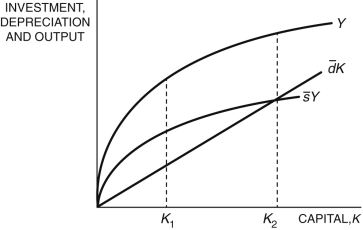
-In Figure 5.3, at K1, the difference between  and
and 
Is ________, and the difference between Y and 
Is ________.
A) output; investment
B) net investment; consumption
C) gross investment; consumption
D) output; consumption
E) depreciation; gross investment
Correct Answer:

Verified
Correct Answer:
Verified
Q45: The amount of capital in an economy
Q46: If the production function is given by
Q47: What are the key assumptions of the
Q48: The Solow model describes:<br>A) how saving rates
Q49: In the corn farm example, saving some
Q51: In the simple Solow model, we assume:<br>A)
Q52: An implication of the Solow model is
Q53: Among the world as a whole, there
Q54: Refer to the following figure when answering
Q55: If the current capital stock in South