Multiple Choice
Refer to the following figure when answering the following questions.
Figure 5.5: Solow Diagram 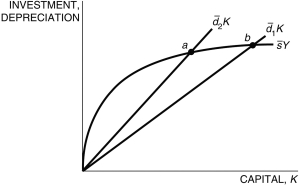
-Figure 5.5 represents two countries, 1 and 2. Country ________ has a higher depreciation rate and, therefore, has a ________ steady state than the other country.
A) 1; higher
B) 1; lower
C) 2; higher
D) 2; lower
E) Not enough information is given.
Correct Answer:

Verified
Correct Answer:
Verified
Q91: In the Solow model, we generally assume
Q92: In the steady state, capital accumulation is
Q93: If we define <img src="https://d2lvgg3v3hfg70.cloudfront.net/TB6622/.jpg" alt="If we
Q94: Considering the figure below, the transitional dynamics
Q95: A surprising result of the Solow model
Q97: Assume a production function is given by
Q98: A decline in the saving rate will
Q99: The key difference between the Solow model
Q100: In the Solow model, in every period,
Q101: Suppose that rather than the Cobb-Douglas production