Multiple Choice
Refer to the following table when answering the following questions.
Table 4.1: Production Model's Prediction for Per Capita GDP (US = 1) 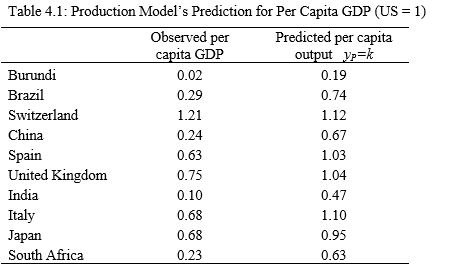 (Source: Penn World Tables 9.0)
-One explanation for the difference between the predicted output per person and the observed per capita GDP in Table 4.1 is differences in:
A) the labor supply.
B) human capital.
C) per capita capital.
D) capital's share of GDP.
E) None of these answers is correct.
Correct Answer:

Verified
Correct Answer:
Verified
Q40: Consider two countries, A and B.
Q115: Exogenous variables are predetermined by the model
Q117: In the Cobb-Douglas production function <img src="https://d2lvgg3v3hfg70.cloudfront.net/TB6622/.jpg"
Q118: In the equation <img src="https://d2lvgg3v3hfg70.cloudfront.net/TB6622/.jpg" alt="In the
Q119: Which of the following are we likely
Q121: What are the three sources of total
Q122: The text uses this analogy of the
Q123: In the United States, each year of
Q124: Which of the following production functions exhibits
Q125: The production function of the form <img