Multiple Choice
Refer to the following table when answering the following questions.
Table 4.1: Production Model's Prediction for Per Capita GDP (US = 1) 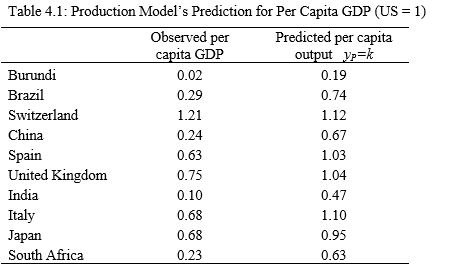 (Source: Penn World Tables 9.0)
-Considering the data in Table 4.1, the explanation for the difference between the predicted and actual level of output is called ________. If you compare South Africa's observed and predicted output, this difference is equal to ________.
A) total factor productivity; 0.37
B) the Solow residual; 2.71
C) Dirac's delta; 0.14
D) capital's share of GDP; one-third
E) labor's share of GDP; two-thirds
Correct Answer:

Verified
Correct Answer:
Verified
Q40: Consider two countries, A and B.
Q41: The law of diminishing marginal product to
Q42: In the Cobb-Douglas production function <img
Q43: Write down the firm's profit maximizing problem.
Q44: The equation <img src="https://d2lvgg3v3hfg70.cloudfront.net/TB6622/.jpg" alt="The equation
Q46: Which of the following explain(s) differences in
Q47: For efficient allocation of resources _ and
Q48: Which of the following explain(s) differences in
Q49: Refer to the following figure when answering
Q50: In models with perfect competition:<br>A) economic profits