Not Answered
The following graph shows the relationship between a large country importer of a good, say steel, and its tariff rate (in percentages). Explain why the curve reaches maximum and then declines. 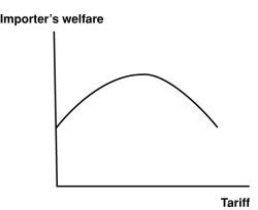
Correct Answer:

Verified
Correct Answer:
Verified
Related Questions
Q32: Section 421 of the amended Trade Act
Q33: Because a large nation can force the
Q34: Suppose that the free-trade price of a
Q35: Which country saw the largest increase in
Q36: Suppose that: (1) the United States has
Q38: Which one of the following statements is
Q39: The following table gives the hypothetical supply
Q40: (Figure: Home Market I) The government revenue
Q41: Which of the following is NOT an
Q42: The safeguard provision or escape clause allows