Multiple Choice
(Figure: Home and Foreign Autarky Equilibria) Which line in the graph represents the home relative price of computers in terms of shoes? 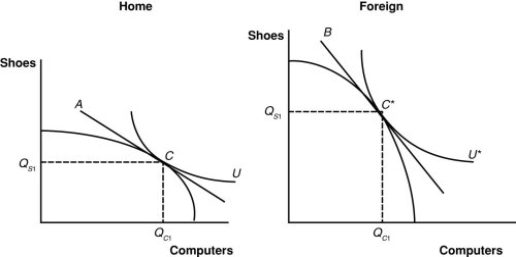
A) A
B) B
C) U
D) U*
Correct Answer:

Verified
Correct Answer:
Verified
Related Questions
Q78: If the wage-rental ratio in Japanese auto
Q79: A long-run model of trade basic to
Q80: Suppose Portugal has 700 workers and 26,000
Q81: The following table represents autarkic and free-trade
Q82: Why is the specific-factors model referred to
Q84: The wage paid to labor should increase
Q85: The conclusion that international trade will lead
Q86: (Figure: Home and Foreign Autarky Equilibria) If
Q87: Which statement best describes the Heckscher-Ohlin model?<br>A)
Q88: Which of the following statements is correct?<br>A)