Not Answered
Suppose that the following table gives export and import price indexes for Zimbabwe in 1990, 2000, and 2014. (The base year is 1990, so all values are 100 in that year.)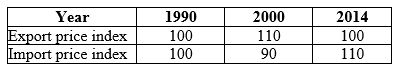
I. How did Zimbabwe's terms of trade change between 1990 and 2000? Between 2000 and 2014? Between 1990 and 2014?
II. Do these changes represent deterioration or improvement in Zimbabwe's terms of trade?
III. What are the implications of a terms-of-trade deterioration for the Zimbabwean economy?
Correct Answer:

Verified
Correct Answer:
Verified
Q5: The international relative price and total quantity
Q6: (Figure: Upperia's Production and Consumption) The graph
Q7: The authors provide evidence that wages rose
Q8: Whenever a nation has a lower opportunity
Q9: When two nations have achieved identical relative
Q11: (Table: United States and China Production per
Q12: (Figure: Upperia's Production and Consumption) The graph
Q13: International trade allows countries to:<br>A) produce outside
Q14: Poland requires 4 hours of labor to
Q15: Assume the <i>MPL</i><sub>c</sub> = 2 cars and