Essay
Solow Diagram 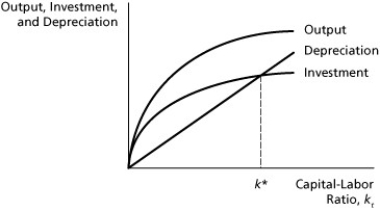
-The diagram above shows a steady state with a constant quantity of labor.Show on the graph how the steady state is determined if the labor force is growing at some constant rate.On the graph,show how to measure the change in consumption per worker that results from growth of the labor force.
Correct Answer:

Answered by ExamLex AI
To show how the steady state is determin...View Answer
Unlock this answer now
Get Access to more Verified Answers free of charge
Correct Answer:
Answered by ExamLex AI
View Answer
Unlock this answer now
Get Access to more Verified Answers free of charge
Q12: In the typical bathtub,the flow of water
Q13: With a closed economy and no government
Q14: Countries with different initial levels of per
Q15: When an economy experiences a one-time increase
Q16: A One-Child Policy was instituted in 1979
Q18: National output is a function of _.<br>A)capital
Q19: Capital and labor are distinct from productivity
Q20: In a closed economy _.<br>A)investment equals consumption<br>B)investment
Q21: Comparing steady states,which of the following is
Q22: If depreciation is equal to investment _.<br>A)capital