Multiple Choice
Figure 6.1 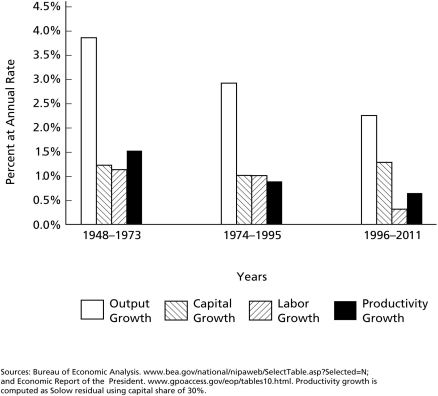
-According to Figure 6.1,the average annual rate of growth of the U.S.economy in the period 1948-73 equalled ________.
A) 1.8 percent
B) 4.0 percent
C) 39 percent
D) 697 percent
Correct Answer:

Verified
Correct Answer:
Verified
Q61: Figure 6.1 <img src="https://d2lvgg3v3hfg70.cloudfront.net/TB5036/.jpg" alt="Figure 6.1
Q62: If productivity is growing at some sustained
Q63: In the past 50 years,per capita income
Q64: Within rich economies,there is strong evidence of
Q65: In the Solow model,the faster growth of
Q67: Economic growth _.<br>A)is driven by different elements
Q69: Given the production function Y = A
Q70: The per-worker production function is _.<br>A)upward-sloping<br>B)downward-sloping<br>C)vertical<br>D)horizontal
Q71: The per-worker production function flattens out due
Q123: There are no questions for this section.