Multiple Choice
Figure 6.1 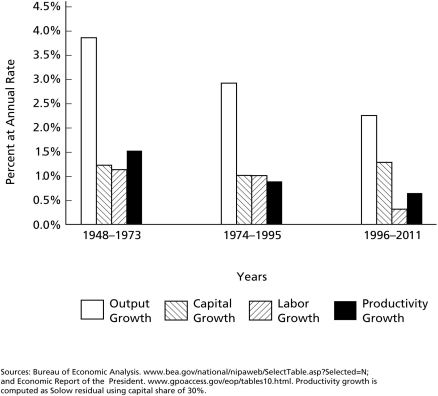
-According to Figure 6.1,the period from 1974 to 1995 is particularly remarkable for the slow growth of ________.
A) output per worker
B) labor input
C) output
D) capital input
Correct Answer:

Verified
Correct Answer:
Verified
Related Questions
Q34: If an economy initially starts away from
Q35: Which of the following is the most
Q36: Figure 6.1 <img src="https://d2lvgg3v3hfg70.cloudfront.net/TB5036/.jpg" alt="Figure 6.1
Q37: In theory,differences in output across economies and
Q38: A higher rate of saving at the
Q40: Given the production function Y = A
Q41: Figure 6.1 <img src="https://d2lvgg3v3hfg70.cloudfront.net/TB5036/.jpg" alt="Figure 6.1
Q42: Output per worker is 50,the saving rate
Q43: If an economy invests more than it
Q44: The growth rate of which of the