Multiple Choice
Figure 13.1 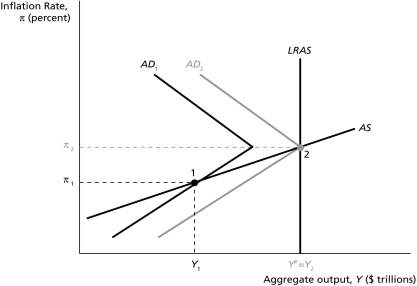
-In Figure 13.1,"the zero lower bound" is displayed at ________.
A) point 1
B) point 2
C) 
D) the origin (intersection of the axes)
E) none of the above
Correct Answer:

Verified
Correct Answer:
Verified
Q1: When a permanent negative supply shock hits
Q2: If workers push for wages that are
Q14: Macroeconomic Shocks & Policies <img src="https://d2lvgg3v3hfg70.cloudfront.net/TB5036/.jpg" alt="Macroeconomic
Q20: If the inflation rate target is 2%,the
Q50: Macroeconomic Shocks & Policies <img src="https://d2lvgg3v3hfg70.cloudfront.net/TB5036/.jpg" alt="Macroeconomic
Q57: When the credit spread rises,an effective policy
Q58: When an aggregate demand shock hits the
Q77: Many borrowers defaulted on subprime mortgages ultimately
Q91: High inflation that persists beyond the ending
Q100: Aggregate Demand and Supply Analysis <img src="https://d2lvgg3v3hfg70.cloudfront.net/TB5036/.jpg"