Multiple Choice
Figure 6.3.1 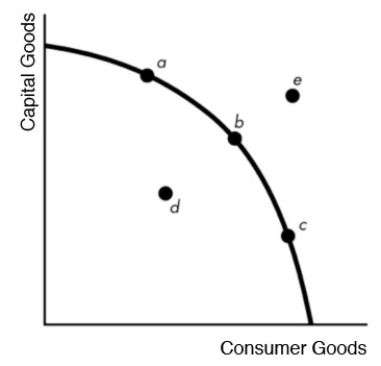
-Look at the macro production possibilities frontier in Figure 6.3.1. Which point(s) represent real GDP less than potential GDP?
A) a only
B) b only
C) a, b, c
D) d only
E) e only
Correct Answer:

Verified
Correct Answer:
Verified
Related Questions
Q26: As the price level in Canada rises,
Q27: When aggregate supply and aggregate demand match,
Q28: The "Yes - Markets Self-Adjust" camp argues
Q29: Low prices in the domestic wheat market
Q30: Full employment is represented by points on
Q32: Demand shocks cause unemployment and inflation to
Q33: Reductions in government subsidies on electricity prices
Q34: Aggregate demand increases when the value of
Q35: Rising input prices shift SAS leftward but
Q36: When there is economic growth with rising