Multiple Choice
A gardener applies a specific fungicide to her plot that kills all mycorrhizal fungi. Which of the graphs below depicts changes in the amount of phosphorus in the soil after application of the fungicide? 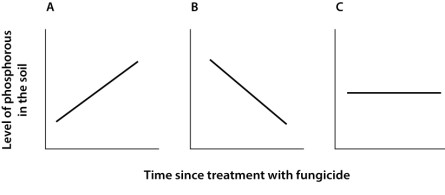
A) graph A
B) graph B
C) graph C
Correct Answer:

Verified
Correct Answer:
Verified
Related Questions
Q113: How do the two species that make
Q114: Which feature of fungi allows the production
Q115: Ascomycetes affect humans in all of the
Q116: The black spots seen on a moldy
Q117: How are the zygote and the dikaryotic
Q119: Imagine that fungal hyphae were as thick
Q120: Aquatic fungi with flagellated spores belong to
Q121: The majority of an individual fungus lives
Q122: A researcher has been studying lichens in
Q123: The network of branching filaments that form