Multiple Choice
Select the BEST set of data for constructing the type of diagram shown below. 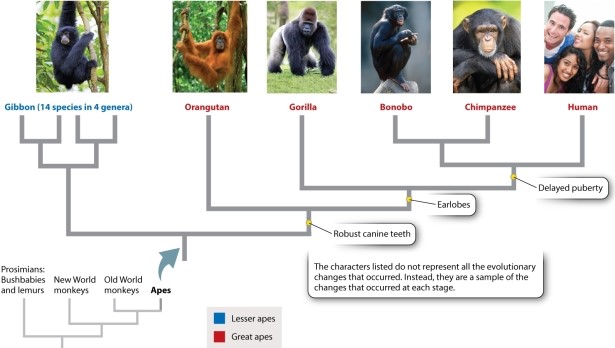 Photo sources: (left to right) Zoonar/K. Jorgensen/age fotostock; S Sailer/A Sailer/age fotostock; J & C Sohns/age fotostock; Michael Dick/ Animals Animals-Earth Scenes; FLPA/Jurgen & Christi/age fotostock; Yellow Dog Productions/Getty Images.
A) molecular data
B) morphological data of extant species
C) anatomical, physiological, and developmental studies of extant species in the fossil record
D) A combination of all of the other answer options would yield the best data set.
Correct Answer:

Verified
Correct Answer:
Verified
Q110: How do mass extinction events influence subsequent
Q111: The Permian mass extinction is hypothesized to
Q112: Among the environments listed below, in which
Q113: In a phylogenetic tree, a node or
Q114: The vast diversity observed in present-day plants
Q116: During the Permian extinction, what percentage of
Q117: A population of rodents, called population A,
Q118: The remarkable fossil of the "fishapod," Tiktaalik,
Q119: Which of the following is MOST likely
Q120: Consider a generalized tree of life, with