Multiple Choice
Which of the graphs below would likely represent the distribution of a simple, single gene trait? 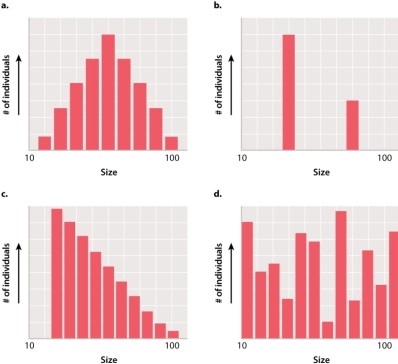
A) graph A
B) graph B
C) graph C
D) graph D
Correct Answer:

Verified
Correct Answer:
Verified
Related Questions
Q47: Which of the traits depicted here illustrates
Q48: Studies have shown that 5%-10% of all
Q49: If the concordance rate for a given
Q50: Which of the following are complex traits?<br>A)type
Q51: Which of the following traits would you
Q53: Salt intake is associated with an increased
Q54: Consider a trait determined by a rare,
Q55: Personalized medicine matches the treatment to the
Q56: Diets high in fat and carbohydrates affect
Q57: Lindsay and Joy are twins that share