Multiple Choice
The plots shown here depict several possible outcomes of an experiment comparing the mean phenotype of a behavioral trait in two strains of mice in three environments. Strain 1 is represented by filled circles and Strain 2 is represented by open circles. Environment 1 (E1) is deficient in stimulation for the behavior, environment 2 (E2) has an average level of stimulation, and environment 3 (E3) is enriched in stimulation. Which of the possible results indicates the absence of genotype-by-environment interaction? 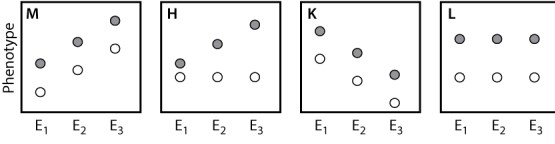
A) result M
B) result H
C) result K
D) result L
E) None of the answer options is correct.
Correct Answer:

Verified
Correct Answer:
Verified
Q38: Consider a trait determined by a rare
Q39: Nilsson-Ehle's studies of seed color in wheat
Q40: Personalized genome sequencing is MOST easily justified
Q41: The scatterplots below show the relation between
Q42: If the value of the trait in
Q44: Red coloration in wheat seeds is a
Q45: When differences in the phenotype due to
Q46: In which of the complex traits shown
Q47: Which of the traits depicted here illustrates
Q48: Studies have shown that 5%-10% of all